Today room 8 did a time series graph using Excel.
First we got the information from metservice http://www.metservice.com/national/home, after that we made some graphs in our books, later we published them and this is my one recording the temperature in nelson. Here is my finished graph.
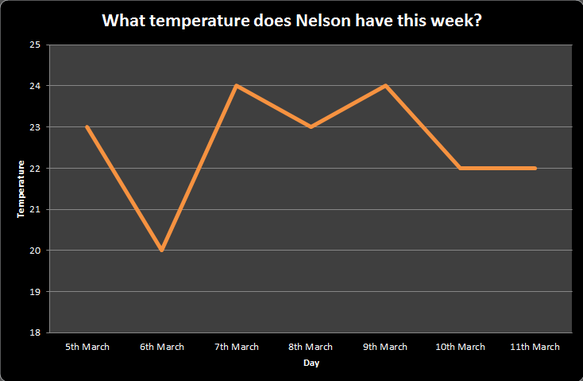
First we got the information from metservice http://www.metservice.com/national/home, after that we made some graphs in our books, later we published them and this is my one recording the temperature in nelson. Here is my finished graph.
This graph shows us that the hottest day will be the 7th and 9th of march and the coldest the 6th of march.

 RSS Feed